vignettes/examples.Rmd
examples.Rmd
library(Graphs)
library(palmerpenguins)
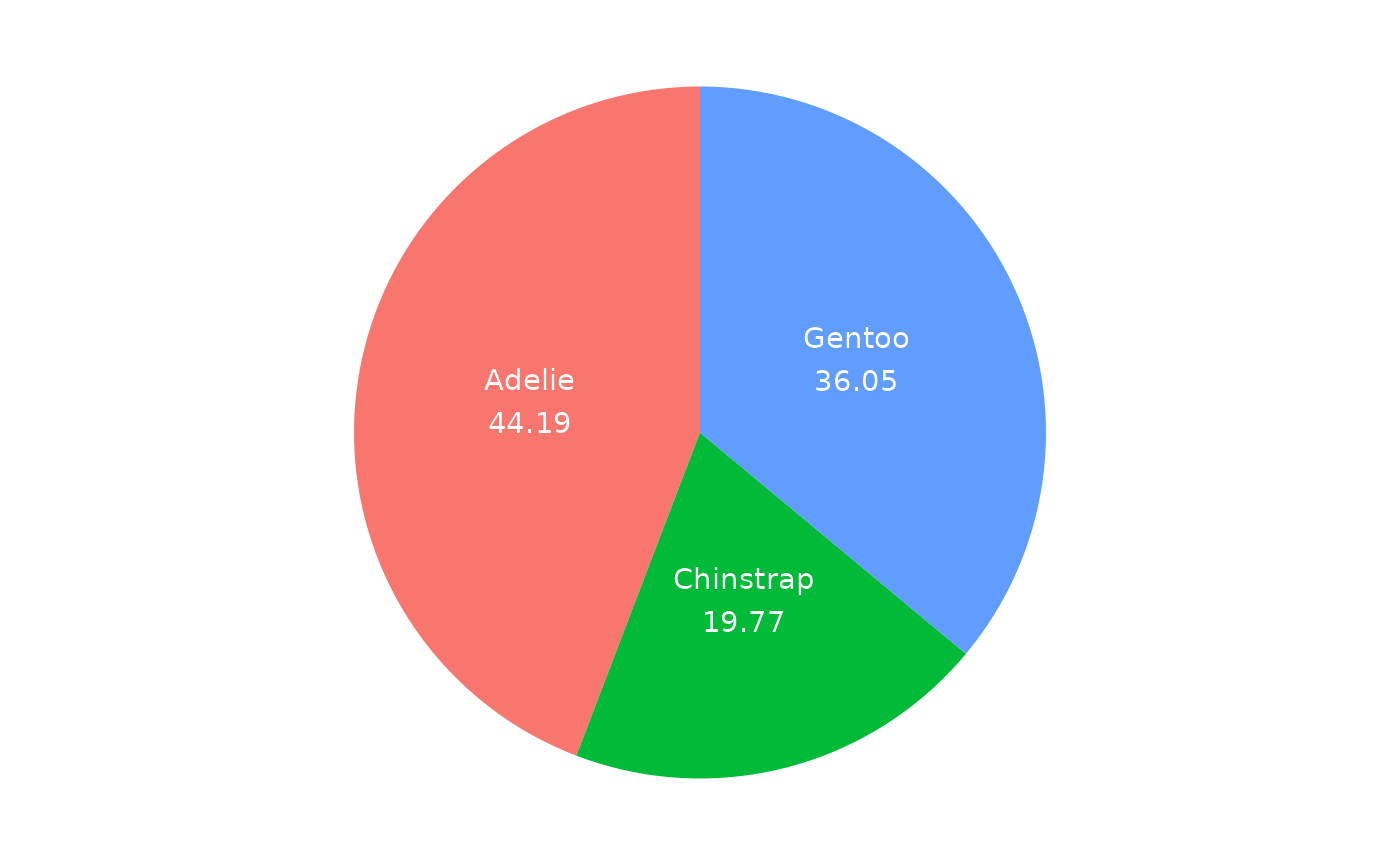
ggpie(penguins, fill = species)
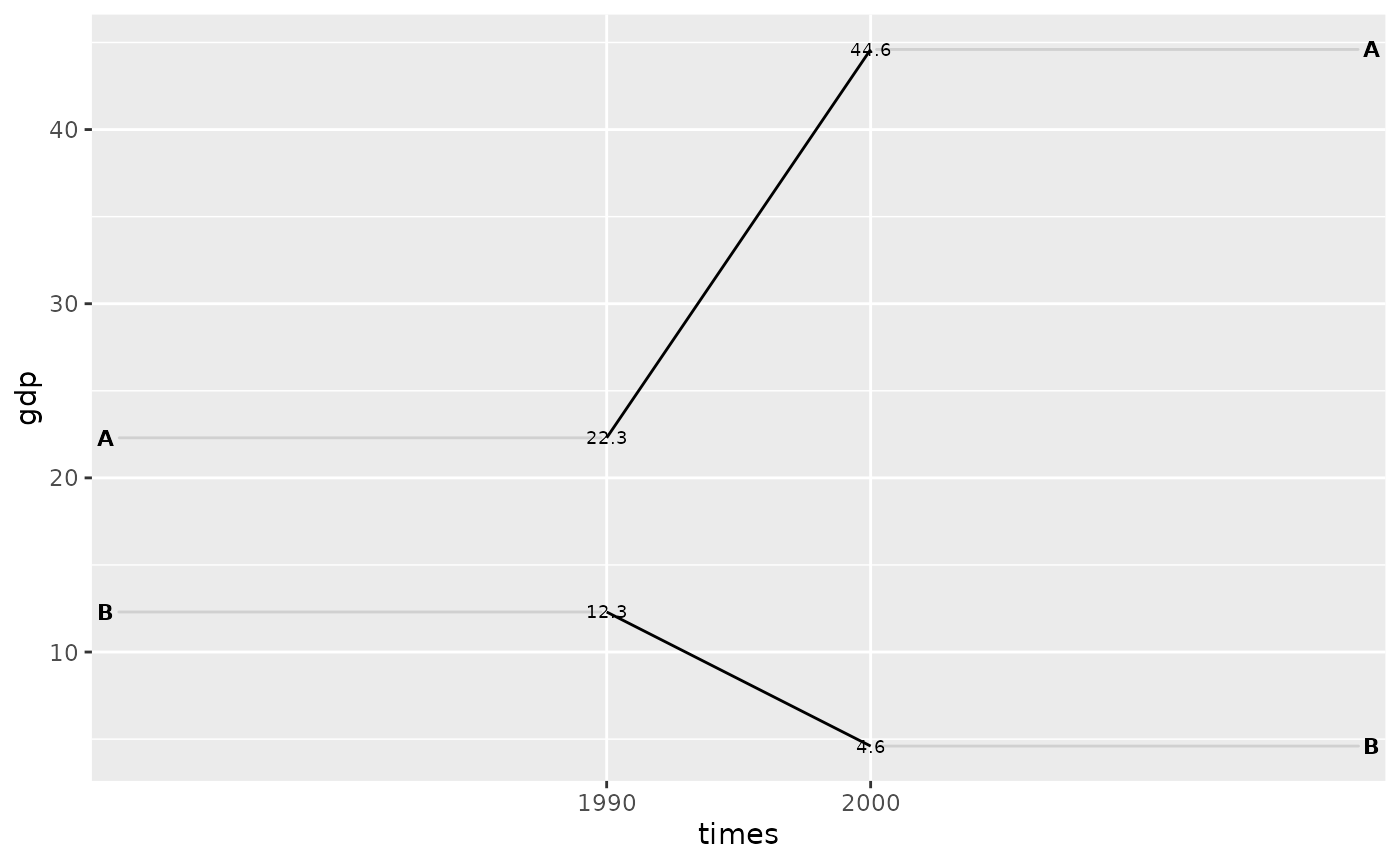
 df <- tidyr::tribble(
 ~times, ~country,  ~gdp, ~inc,
 "1990",   "A",  22.3, TRUE,
 "2000",   "A",  44.6, TRUE,
 "1990",   "B",  12.3, FALSE,
 "2000",   "B",  4.6, FALSE
 )

ggslope(df,
         times = times,
         outcome = gdp,
         group = country)