This is a personal R package for different stuff made with R. It installs the source code of illustrations, apps, and functions that I wanted to recycle (e.g., slope plots with ggplot2). Feel free to reuse the code for your own projects, but of course, you can install this package as well.
Installation
You can install the package from my GitHub account:
# install.packages("devtools")
devtools::install_github("edgar-treischl/edgar")
The rest of this page provides an example of the package’s content. You can find more examples under articles.
Shiny Apps
I created several shiny apps for different purposes. For example, the power app illustrates what statistical power is and how it depends on the sample size, effect size, and significance level by letting the user adjust those parameters on the fly.
Illustrations
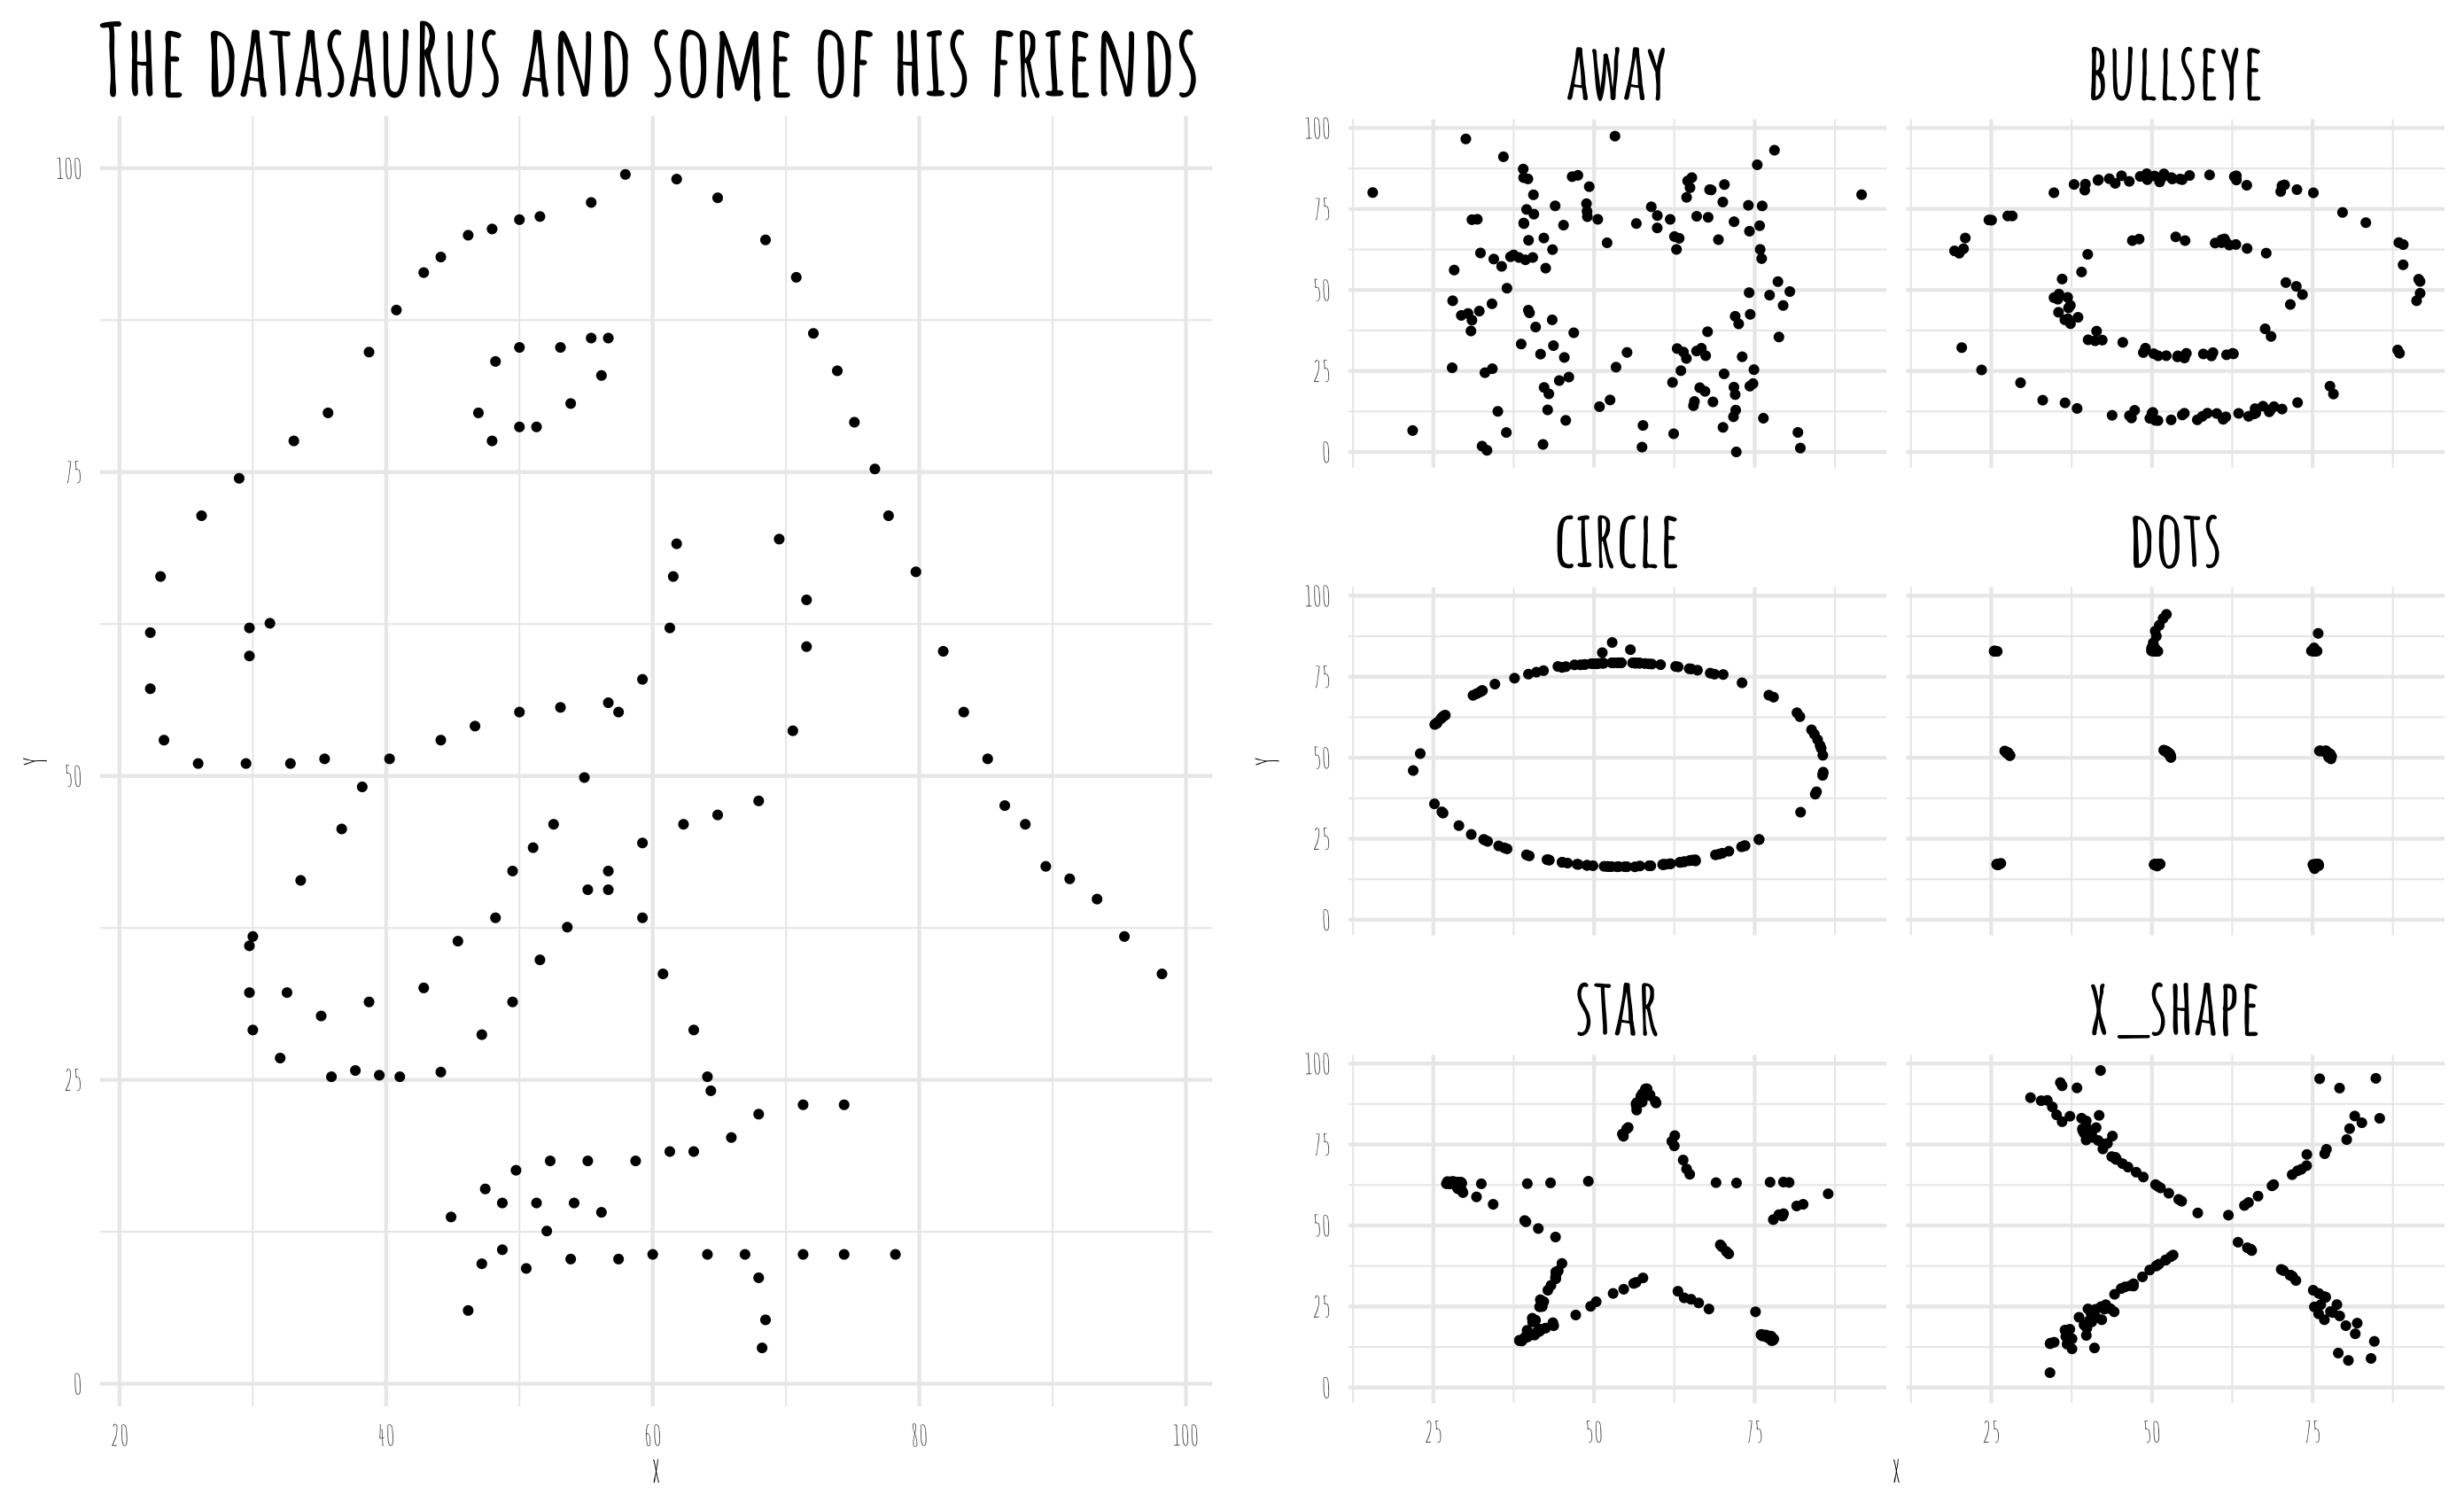
Every now and then I searched in my own code for a specific graph that I wanted to reuse. The package includes some of the graphs that I created which might be a good starting point for my future self or for your own project. The plotgraph() function runs the installed source code and returns the graphs. For example, do you know the datasaurus plot?
# plotgraph function runs the source code
library(edgar)
plot_graph("datasaurus.R")
Without input, the plotgraph() function returns available graphs.
# list available graphs without input
plot_graph()
#> Error in plot_graph(): Please run `plotgraph()` with a valid argument.
#> Valid examples are:
#> anscombe_quartet.R
#> boxplot_illustration.R
#> boxplot_pitfalls.R
#> data_joins.R
#> datasaurus.R
#> gapminder.R
#> long_wide.R
#> pacman.R
#> simpson.R
#> ucb_admission.R
Graphs
And the package gives access to helper functions to make or improve ggplot2 graphs. For example, ggslope() returns a slope plot and you may reuse it if you provide the necessary data. The function is a wrapper for geom_segment() and geom_text() and is useful to compare the change of a variable over time or between groups. The following code shows how to use the function.
library(tidyr)
library(ggplot2)

#example data
df <- tribble(
 ~times, ~country,  ~gdp, ~inc,
 "1990",   "A",  22.3, TRUE,
 "2000",   "A",  44.6, TRUE,
 "1990",   "B",  12.3, FALSE,
 "2000",   "B",  4.6, FALSE
 )

#slope plot
ggslope(df,
        times = times,
        outcome = gdp,
        group = country)+
  theme_minimal()

