The package provides the source code of illustrations, shiny apps,
and functions to make ggplot2 graphs.
Illustrations
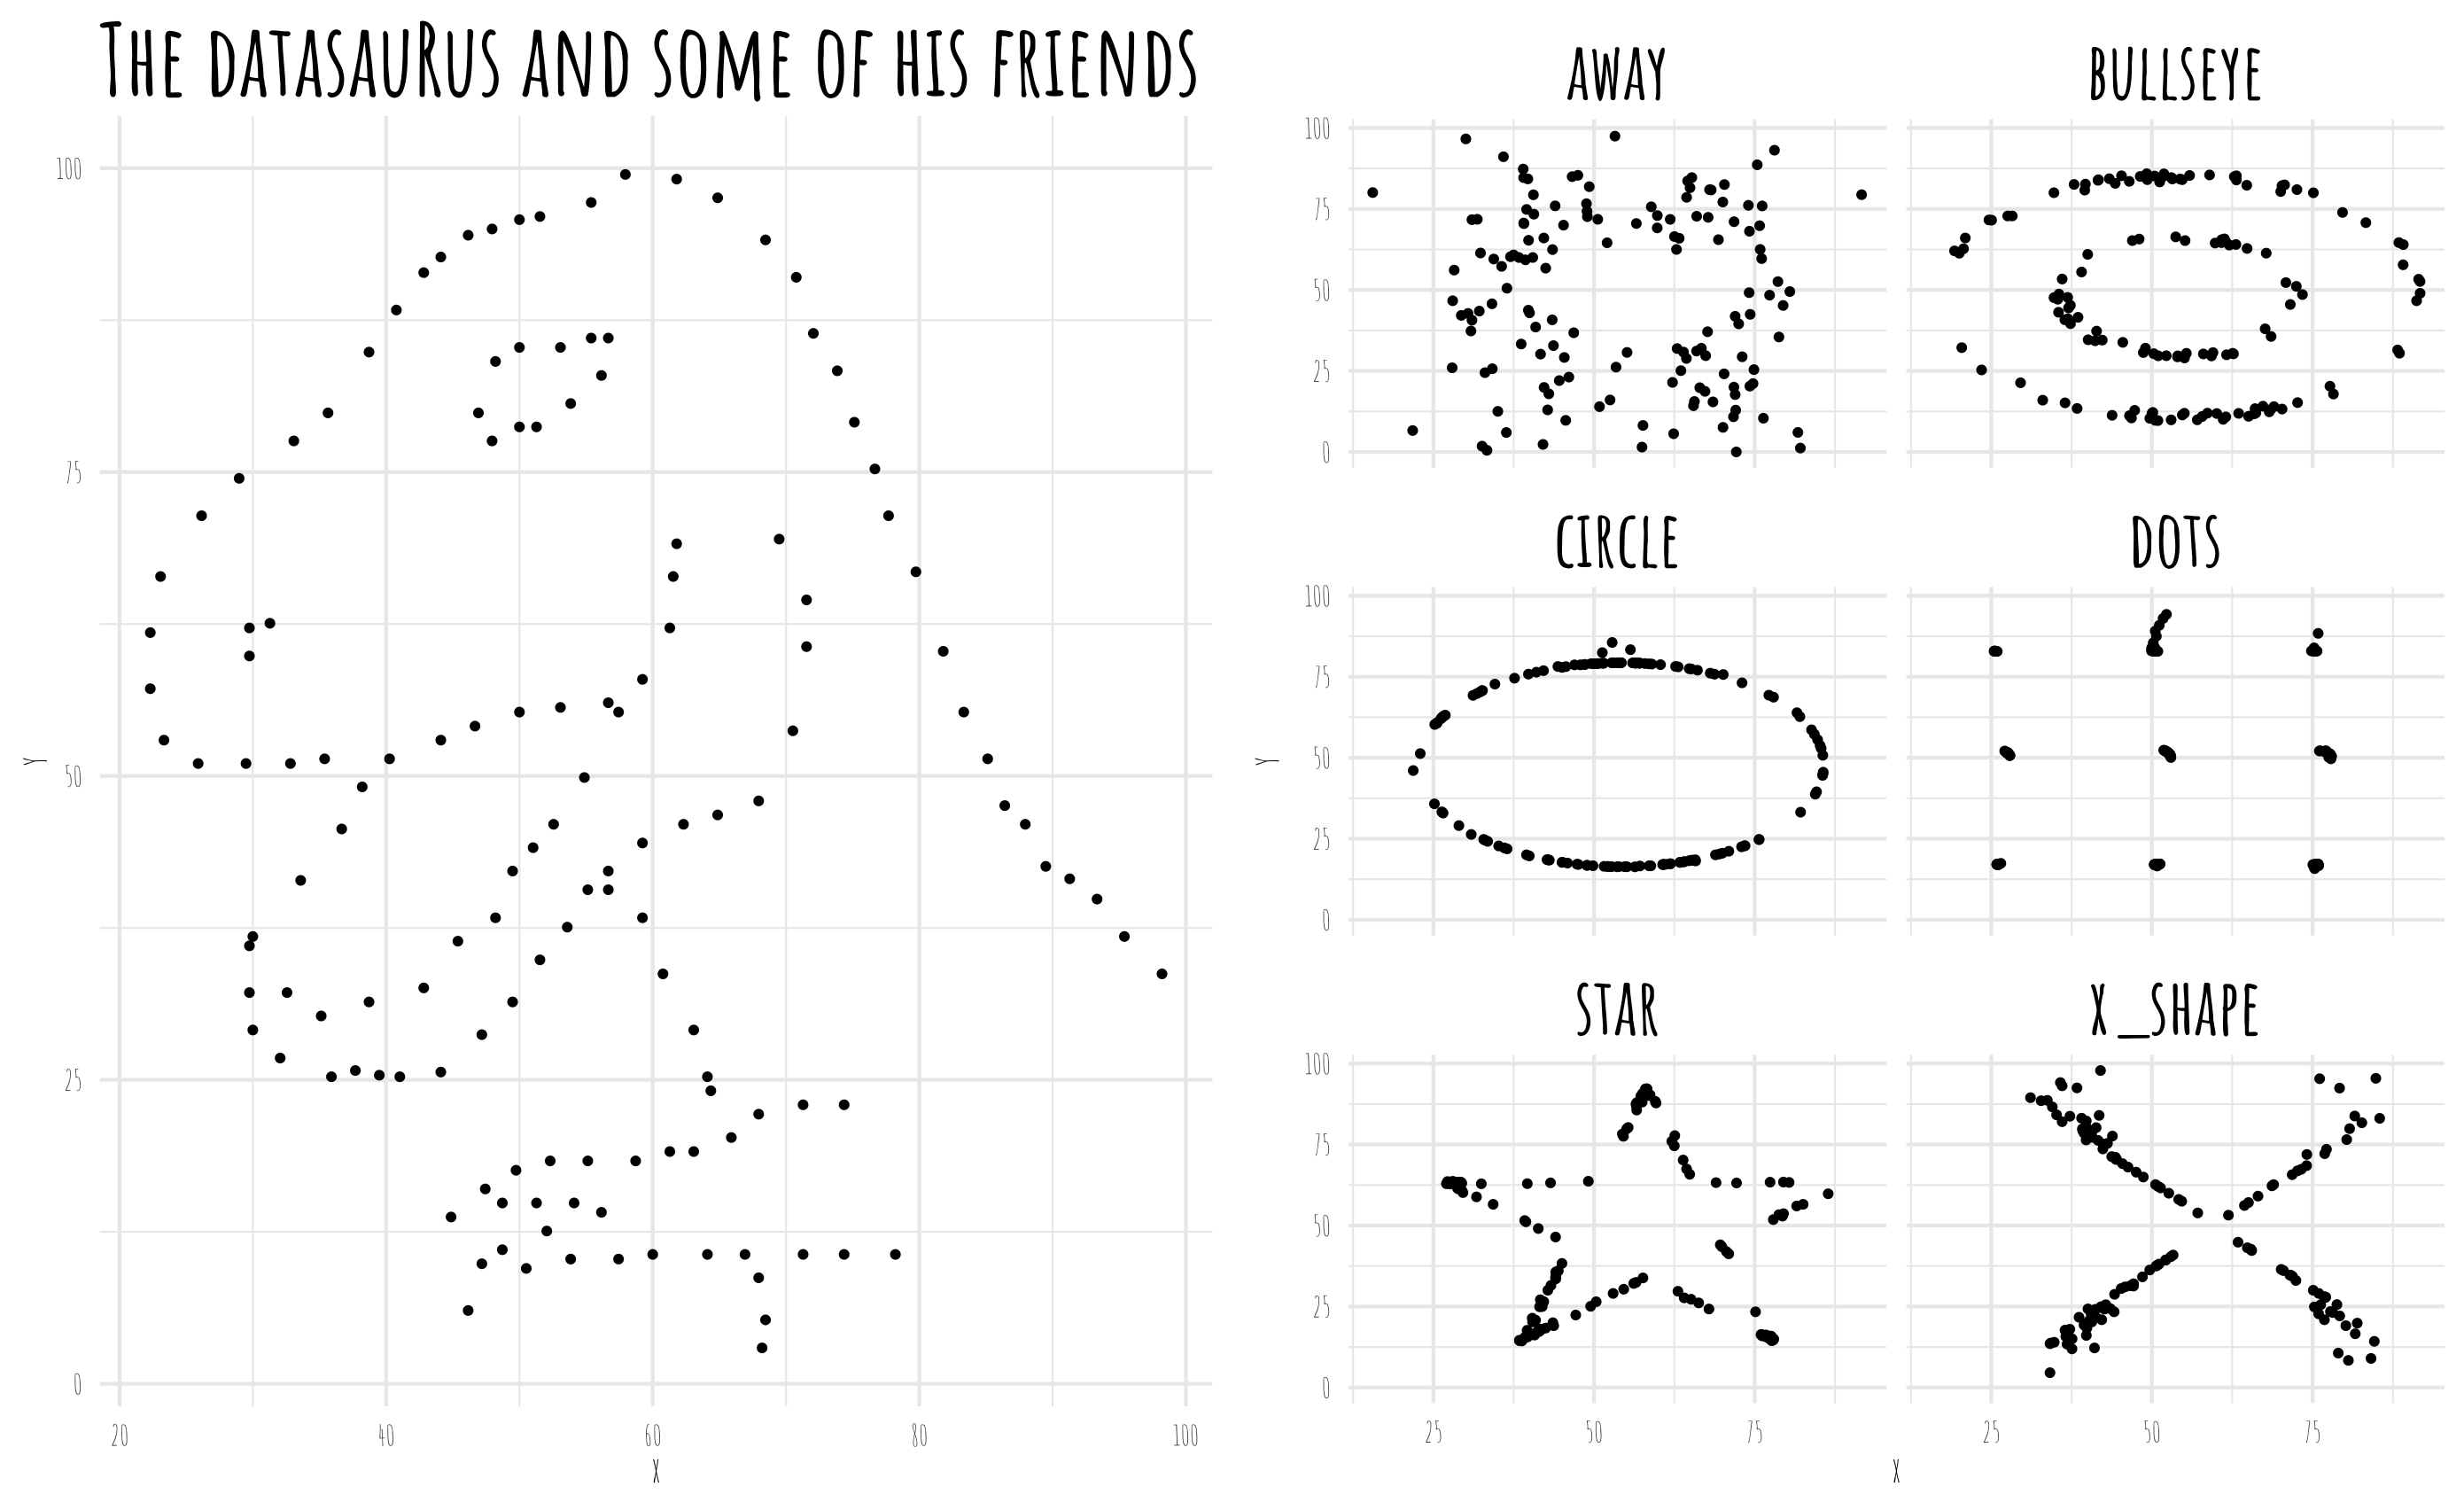
The package installs the source code for all illustrations from this
website. The plotgraph() function just picks the installed
source code and returns the graphs. For example, the
datasaurus plot.
Inspect the website to for a specific graph. Without input, the
plotgraph() function returns all available graphs.
plotgraph()
#> Error in plotgraph(): Please run `plotgraph()` with a valid argument.
#> Valid examples are:
#> anscombe_quartet.R
#> boxplot_illustration.R
#> boxplot_pitfalls.R
#> data_joins.R
#> datasaurus.R
#> gapminder.R
#> long_wide.R
#> pacman.R
#> simpson.R
#> ucb_admission.R
Graphs
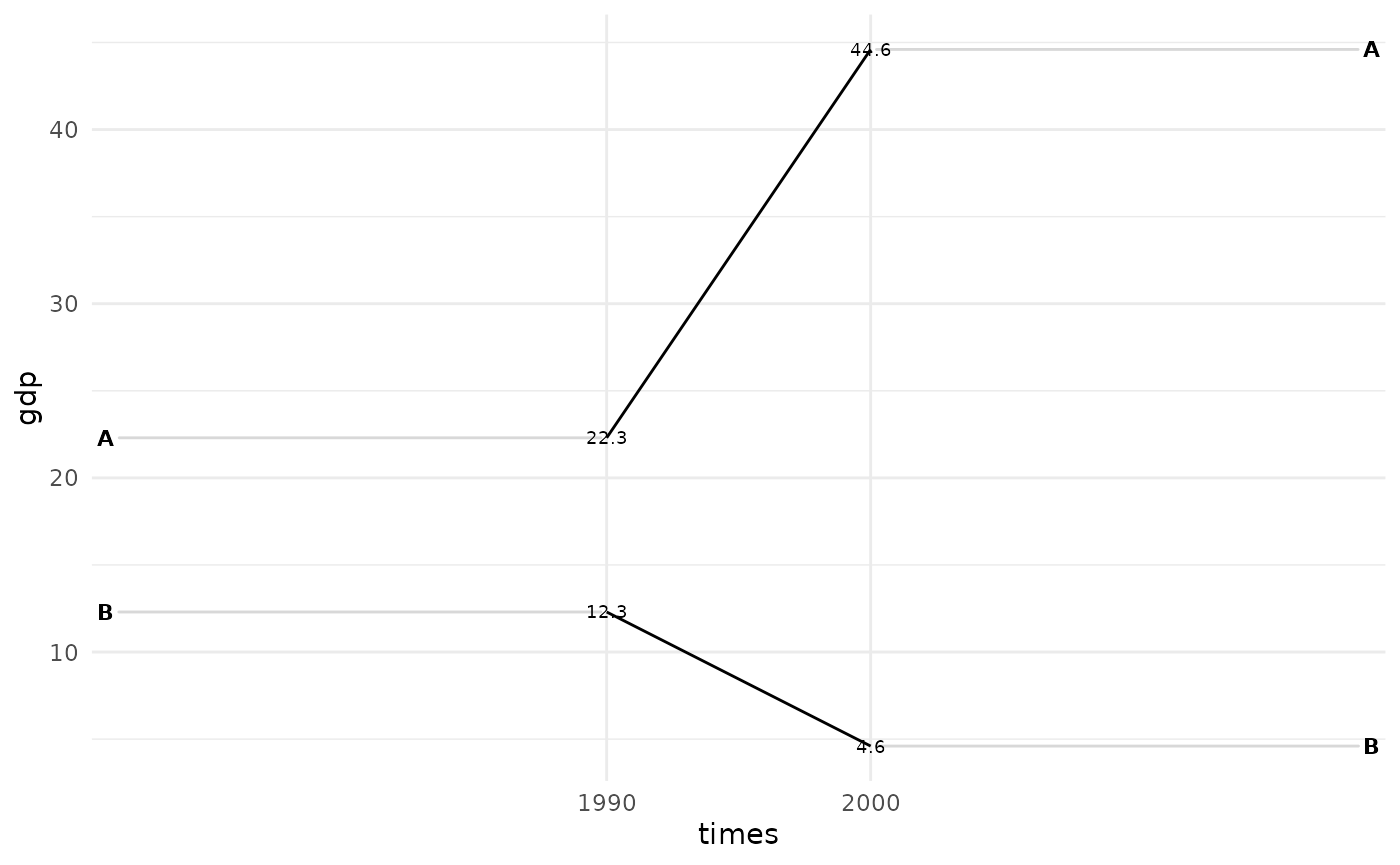
And the package gives access to shortcut functions to make
ggplot2 graphs. For example, ggslope() returns
a slope plot.
library(tidyr)
library(ggplot2)
df <- tribble(
 ~times, ~country,  ~gdp, ~inc,
 "1990",   "A",  22.3, TRUE,
 "2000",   "A",  44.6, TRUE,
 "1990",   "B",  12.3, FALSE,
 "2000",   "B",  4.6, FALSE
 )

ggslope(df,
         times = times,
         outcome = gdp,
         group = country)+
  theme_minimal()